.png?height=120&name=explori_logo%20(1).png)
When looking through the data from your survey, you can use Advanced Cross Tabs in order to examine the relationship between the responses of at least two questions within your survey to find out where they intersect.
Similar to standard Cross Tabbing within Explori, Advanced Cross Tabs will ask you to choose which questions you are using as the columns and rows. You can either add individual questions by dragging them from the left hand side into the columns or the rows box. For the Columns it is recommended to pick no more than 1 or 2 questions, as otherwise the cross tabs generated will be quite complex. For the Rows, we recommend including any KPIs or ratings questions you wish to compare by - alternatively you can press the “Add All” button to include all questions.
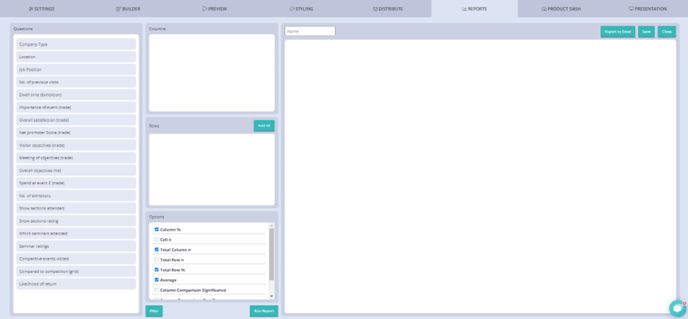
When running your cross tabs, you are asked to choose the following options for your cross tabs to display:
- Column % - shows the options as a percentage of all selections for the column option.
- Cell n – shows the number of selections for the combination of row and column.
- Total Column n – shows the overall number of responses that selected the column option.
- Total Row % - shows the overall option %s for the question used for the rows of a particular question
- Average – if Numeric Values are present for a question used for a row, this will show the average of those values per column
- Column Comparison Significance – will display letters for each column in a given question, which will then appear next to options where this is minor or major significance relative to other options.
- Average Comparison Significance – arrows will display below each question to show whether the result is significantly higher or lower than the question average.
- Cell Significance - arrows will show next to each option to show if the result is significant in comparison to other groups.
Below is a more detailed explanation behind each significance option and how this applies to your results.
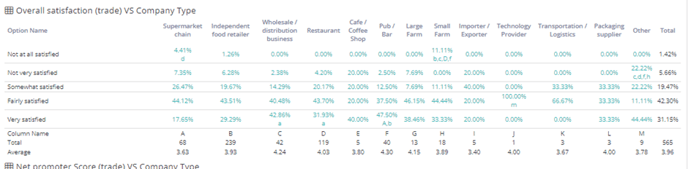
Column Comparison Significance
When Column Comparisons is selected, the significance testing compares pairs of columns within each row. Each column is assigned a letter A, B, C, etc. Each cell is compared with the other cells in the same row, and if a letter is displayed in the cell, this signifies that a cell is significantly different to the cell in the same row in the column letter highlighted in the cells. If a letter is in lower case, this shows that via significance testing that the outcome is given with 95% confidence the difference is significant. If an upper case letter is shown instead, this shows that significance testing is 99% confident the result is significant.
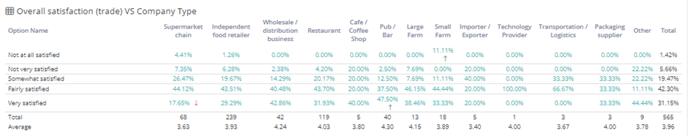
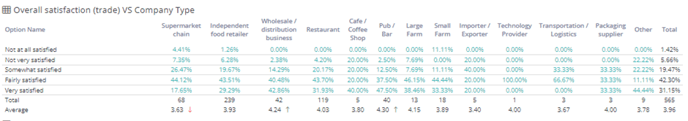
Average Comparison Significance
This compares the average score of a specific column average (driven from the numeric values set within the questions). In the example below, we are comparing with respondents who selected a particular Company Type, and comparing their feedback those who did not select that Company Type). This is achieved via independent Samples t-Test - Comparing Two Means with Unequal Variances. If an up or down arrow is displayed, this signifies that significance testing gives at least 95% confidence that the differences between the two averages are significant.
Cell Significance
This compares two proportions. The cell highlighted is one proportion, and the other proportion is those who did not select the option selected in the highlighted row. If an up or down arrow is displayed, this signifies that there is at least 95% confidence that the differences between the two averages are significant*.