.png?height=120&name=explori_logo%20(1).png)
The functionality of Explori's Cross Tabs allows you to interrogate the data that is already available in the report and take a closer look at your survey responses by seeing the relationship between two questions and where the responses to those intersect.
Once selected, The Cross Tabs button will expand and you will see the following;
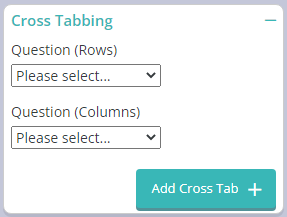
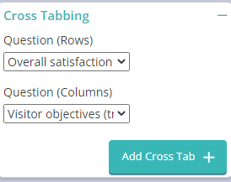
In order to generate Cross Tabs, you will need to select questions that need to be added into the Rows and Columns to generate the new chart:
- Questions (Rows): Typically this would be a question which you want to measure and see how the performance is - the Explori KPIs would be good here, but other measurable questions would also work.
- Question (Columns): This should be a way to split your audience into identifiable groups. This may either be by their job role or sector, or be a behaviour that they have shown at your event.
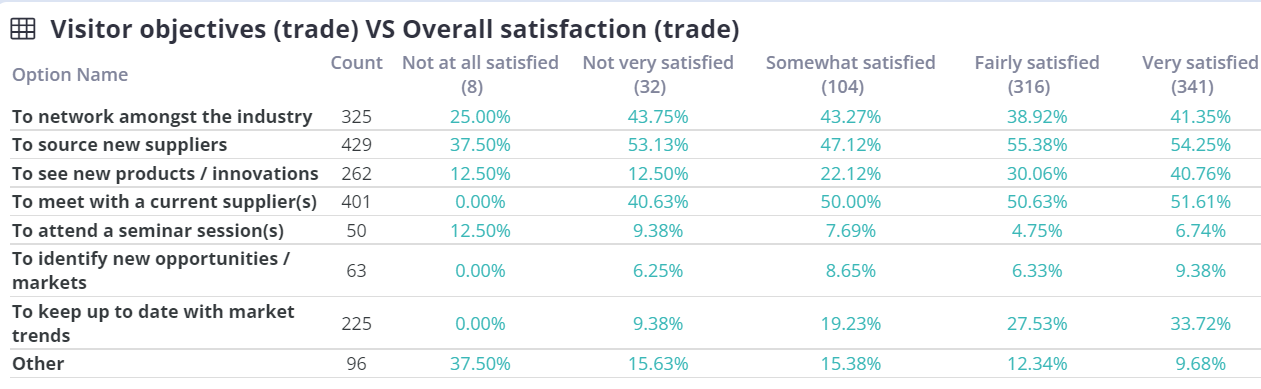
The example below gives how Overall Satisfaction is affected given a respondent has selected that they had a particular objective: