![explori_logo (1).png]](https://kb.explori.com/hs-fs/hubfs/Explori%20logos/explori_logo%20(1).png?height=40&name=explori_logo%20(1).png)
The Data Explorer allows you to generate reports from the data stored within the platform, allowing you to summarise key information, including the KPIs, and compare results across your company as well as the industry.
To access the Data Explorer, select Data Explorer on the side menu.
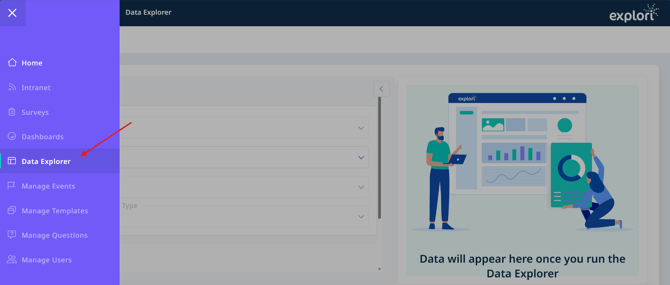
Once you have entered the Data Explorer, you will be given the option to filter by Product Type, Survey Type and Respondent Type.
.gif?width=670&height=306&name=Screen%20Recording%20-%20Mar%2031%2c%202026%20(2).gif)
Once you have selected your options, a list will populate with the relevant questions relating to your filters. Simply drag and drop the questions you would like to report on and run the report. Please note that only Explori and Company questions will appear here.
The data will populate, showing you the scores across all of your different events, as well as a summary across all events within your Company.
Add Filters
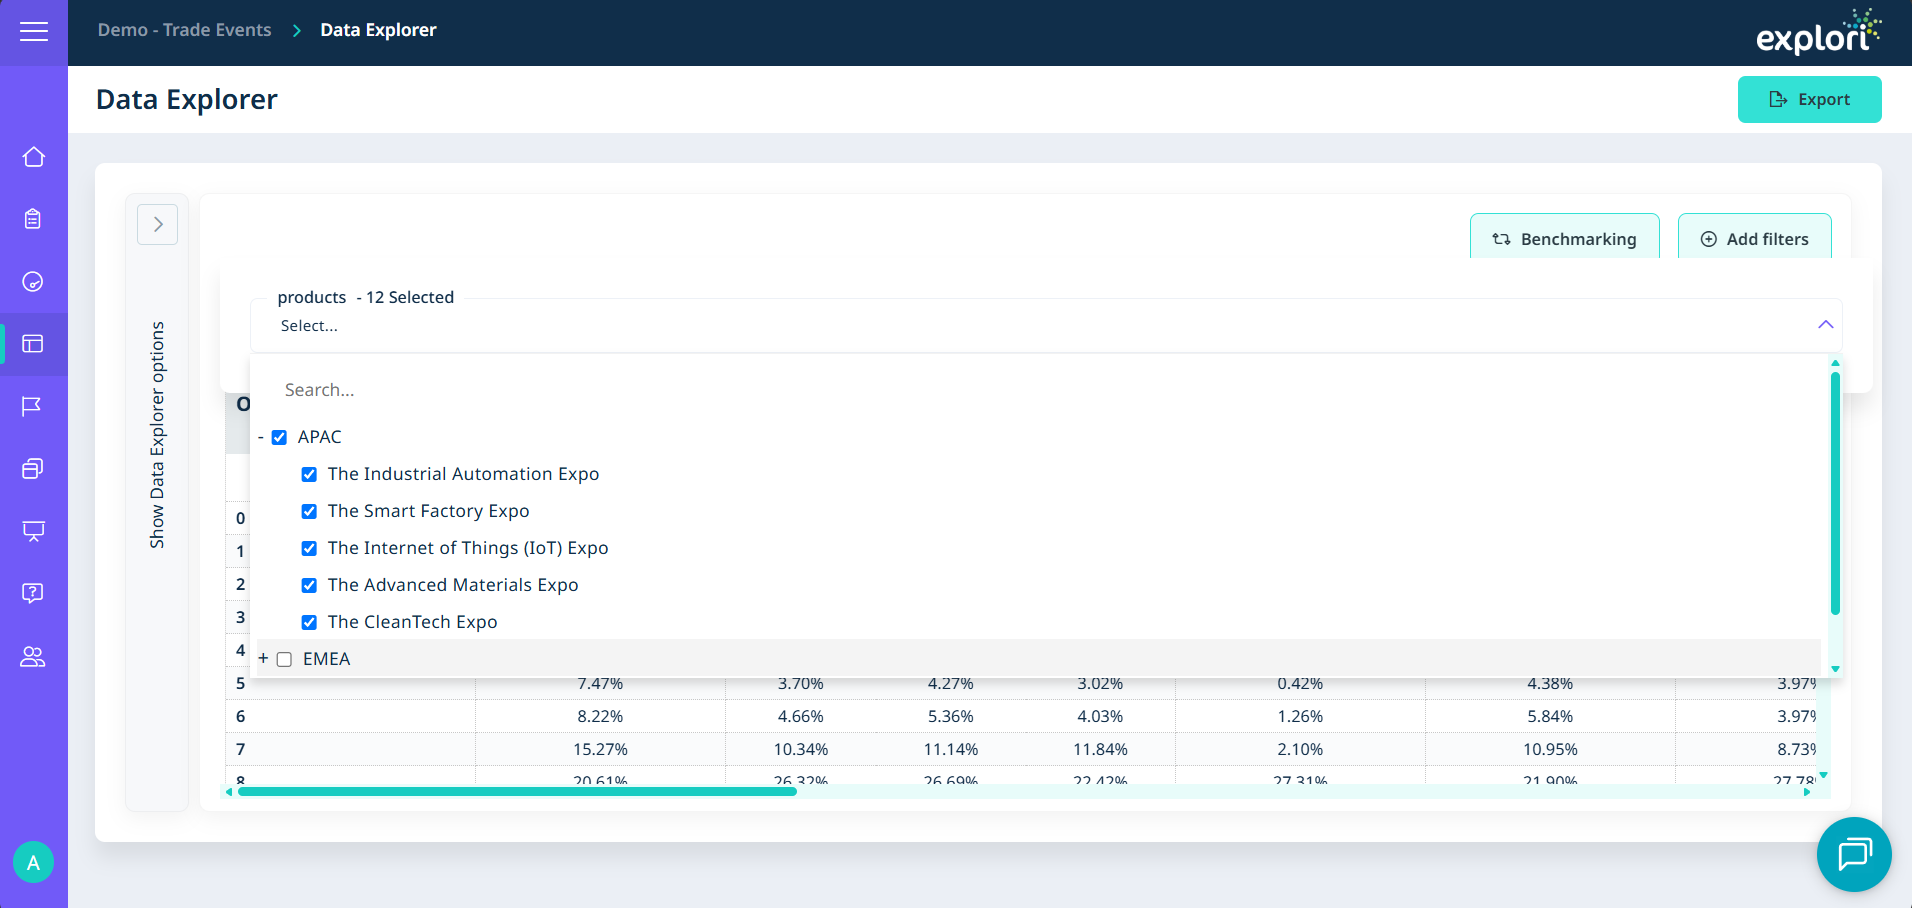
‘Add filters’ can be used to filter out any products you do not wish to include in the report. Simply untick the events or products you do not want in your data.
Benchmarking
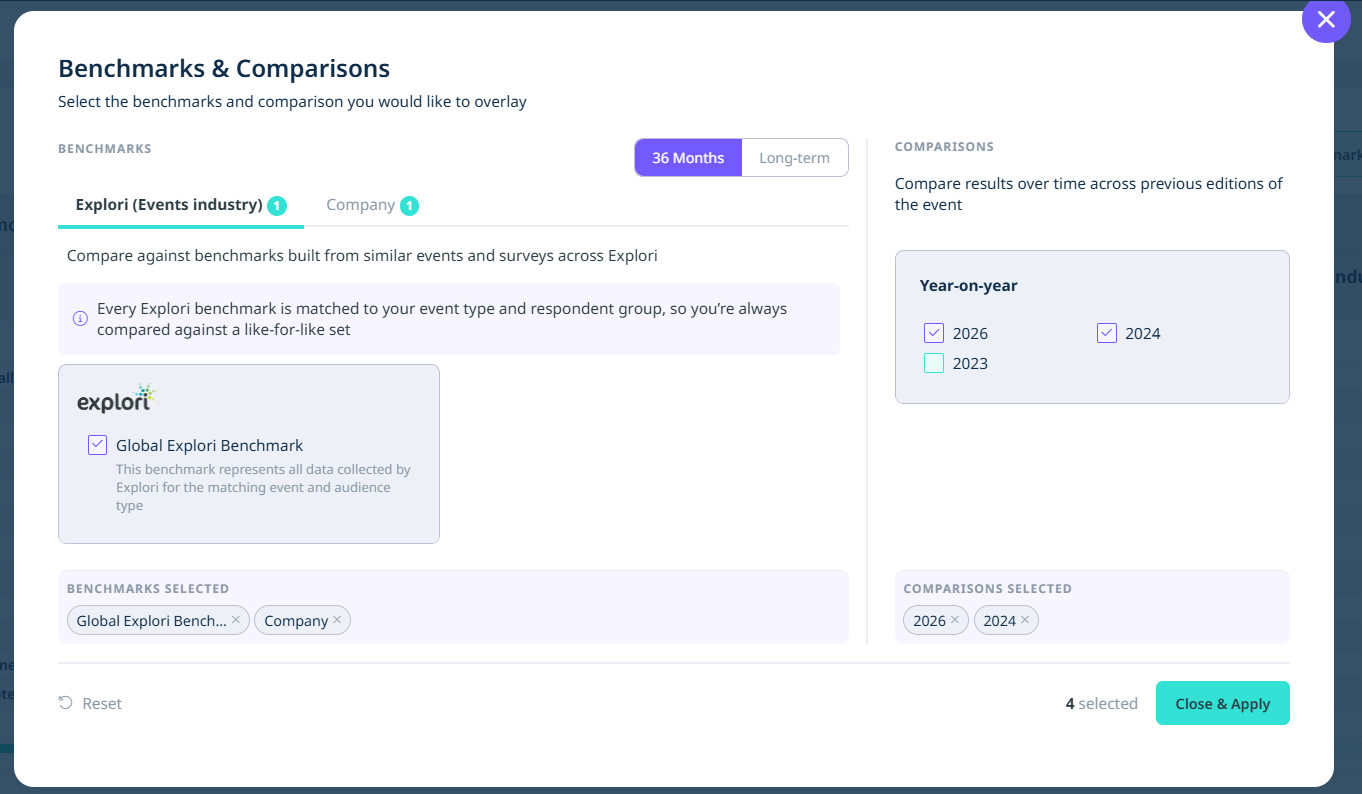
Use benchmarking to select which benchmarks you would like to compare with your scores.
You can choose to compare year-on-year scores and data from the last 36 months or include long term data
Once you’re done selecting your data, you can export the table into a CSV file for further reporting and analysis.