Feedback surveys? Only for lovers or haters?
Whilst more and more event planners are turning to online surveys to gauge customer feedback, some still have concerns about the validity of the data if they are planning to use it to inform their event strategy - are they right?
New clients sometimes ask us if people are only motivated to fill in online surveys if they’ve got something really good or really bad to say, missing the views of the “average” attendee.
So what does the data say?
Using a sample of 146,000 attendees who completed post-show surveys from the database of over two and a half million survey responses collected by Explori in the last 12 months, we examined the response to the question: how likely are you to recommend the event to a colleague / friend, to find the Net Promoter Scores (NPS).

NPS response is divided into three categories:
- Those who give scores of 0-6 out of 10 are classed as detractors
- Scores of 7-8 are passives or neutral
- Scores of 9-10 are promoters
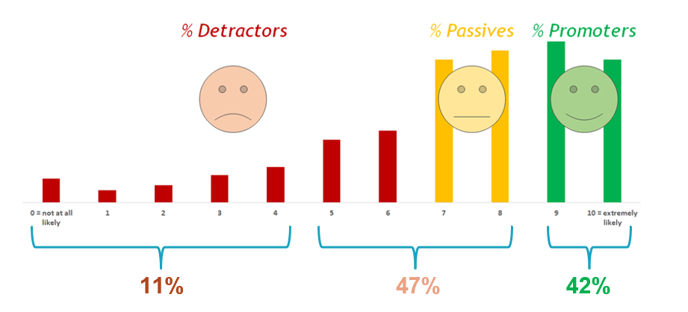
In our sample, 11% fell in the detractor camp, 42% in the promoter band and 47% in the neutral or passive band.
So, there was certainly a large group of people with middle-ground views who had chosen to give feedback. With almost a third of respondents sitting happily in the neutral camp, (with scores of 7 and 8) and another 15% “a little underwhelmed” with scores of 5 or 6, this group is more sizeable than both the “lovers” or the “haters”. When it comes to post-show online surveys, “Average Jo” is quite happy to give her opinion.
Online surveys vs face-to-face
But we also see more of a spread to the extremes of the scale, including 3.5% rating the show they attended as 0 or 1 out of 10. It is this group that can sometimes be under-represented in face-to-face surveys conducted during the event.
By collecting your feedback online after the event, you have given your attendees the fullest possible time to form their opinions of the event. In this respect, it could be argued that there is more validity to their response than one taken part-way through the experience.
Think about the very direct feedback you get from your attendees (whether they will attend next year). Do you find their responses are more neutral (don’t know whether they will or not) at the beginning of the event and more polarised (they definitely will not) towards the end or shortly after the event? Which do you feel most represents their “true” opinion?
Social nicety also comes into play. Many people temper their opinions when they are talking to a real person – an unconscious attempt to protect the feelings of the interviewer, or to appear a better person before them. This can particularly impact responses to questions around income, job seniority and attitude towards professional development, where some answers are perceived to be more socially desirable than others. It also buffers the results against very low NPS scores. In results published by a UK research agency*, it appeared not a single respondent had given a score of 0 when surveyed face-to-face.
You could address the “nice-factor” by placing self-serve terminals at your event in an area you are confident will attract the full spectrum of your attendees, but the cost of build and loss of prime space can make this unappealing.
So, should you be concerned if there is a variance between the data you get online and the data you would get face to face? Well not if you compare apples with apples; if you consistently collect your data in the same way, you are not going to run into problems when you compare year-on-year. You should also look for data that has been collected in the same way if you are want to benchmark externally.
You know your audience – are there any groups through demographic or line of work inaccessible through email? Or are you looking for the views of a vital subsection of your audience? Then, consider combining online and offline research to help you meet your objectives. Agencies with experience in both, or online platforms with offline partners, will be able to deliver both and work the data to give meaningful comparisons.
In conclusion, online surveys are cost-effective and increasingly sophisticated at capturing the full opinion spectrum from lovers to haters and everyone in between. Their big sample sizes lend themselves to detailed analysis and comparisons of the experience of segments of your visitors and they eliminate the “human” bias.
But you may find you get differing responses between any research conducted at the show and online after the show. It would be limiting to see either as being the “true” opinions of your delegates – they both need to be treated in context when drawing conclusions and compared against appropriate benchmarks to help you turn your data into something meaningful to your event strategy.