Benchmarks explained
Explori is the owner of the largest database of post-event performance data in the entire world, working with over 4,000 events worldwide. As such Explori offers various benchmarks which shows the performance of an event compared to the following breakdowns of the industry data that is held in our database.
When viewing benchmarks within Explori, there are two options:
* 36 month rolling benchmark - this is our default option and what is recommended to use
* Long-term benchmark - this includes all surveys, regardless of when the event took place
Industry Benchmark:
This is the average score for this question for all surveys which fit under the same category as your survey in Explori (trade or consumer event, visitor/exhibitor/non-attendee survey). As an example, the average trade visitor NPS figure comes from a base of over 2,500 trade show visitor surveys. Be aware that this is an average of all surveys, rather than all events (so events which have had multiple editions surveyed in Explori would contribute multiple sets of scores to our benchmarks).
Company Benchmark:
This is the average score for a question for all surveys conducted by your company historically which fit under the same category as your survey in Explori (trade or consumer event, visitor/exhibitor/non-attendee survey).
Portfolio Benchmark:
This is the average score for a question for all surveys which fit under the same category as your survey in Explori (trade or consumer event, visitor/exhibitor/non-attendee survey) which sit under the Portfolio in Explori for that event.
Sector Benchmark:
This is the average score for this question for all surveys which fit under the same UFI category as your survey in Explori (trade/consumer/conference/virtual event, visitor/exhibitor/non-attendee survey) where the Event in the system is in the same sector. We have this at present for the 4 main KPI questions used in benchmarking surveys.
- Net Promoter Score (all event types)
- Overall Satisfaction (all event types)
- Likelihood of Return (all event types)
- Importance of Event (Trade/Conference)
- Value for Time (Virtual Event)
- Value for Money (Consumer)
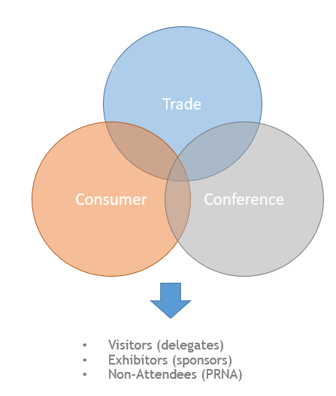
All event types (Trade, Consumer, Conference. Virtual Event for Expos; Internal Events, External Events, 3rd Party Exhibits for Corporates) are benchmarked separately so that shows and their customers are being compared to similar audiences for benchmarking purposes.

Note that the Explori benchmarks run off of the averages of the proportions of individual surveys that contribute to the benchmarks, rather than an average all respondents. This ensures that our benchmarks are a reflection of the 'average event' rather than the 'average respondent'.