.png?height=120&name=explori_logo%20(1).png)
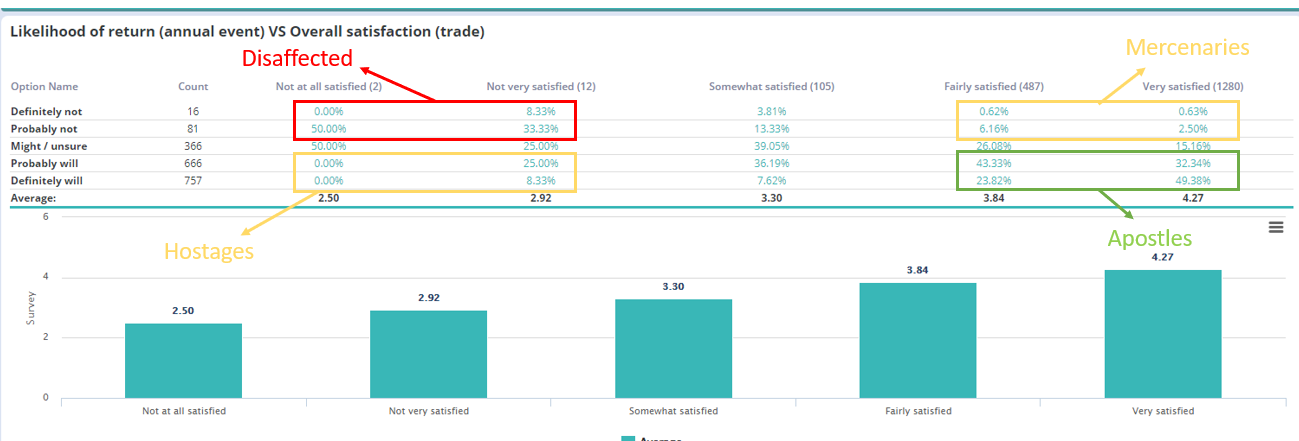
The Loyalty VS Satisfaction Matrix is based from a cross-tabulation between the Likelihood of Return and Overall Satisfaction questions, which are two of the KPIs used by Explori.
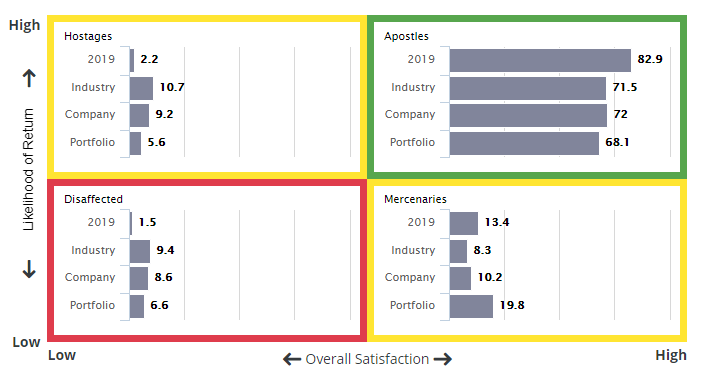
Using this crosstab, Explori will break down your respondents into 4 groups:
What does each section mean?
- Your most positive and vocal group are your Apostles. These attendees have scored their satisfaction highly and feel they are very likely to return to your event. They are both satisfied and loyal.
- Hostages are also very likely to return – but don’t think this is because they like you! They are much less satisfied with your event, but they don’t think they have any better alternatives available.
- Mercenaries are an interesting group. Whilst they are satisfied with your event, they are not loyal and just as likely to be sat at someone else’s event come next year. They are transient and may have low loyalty to the sector they currently work in, or events as a whole.
- Your least positive group are the Disaffected. These delegates were not satisfied with your event and guess what – they are not planning to return.
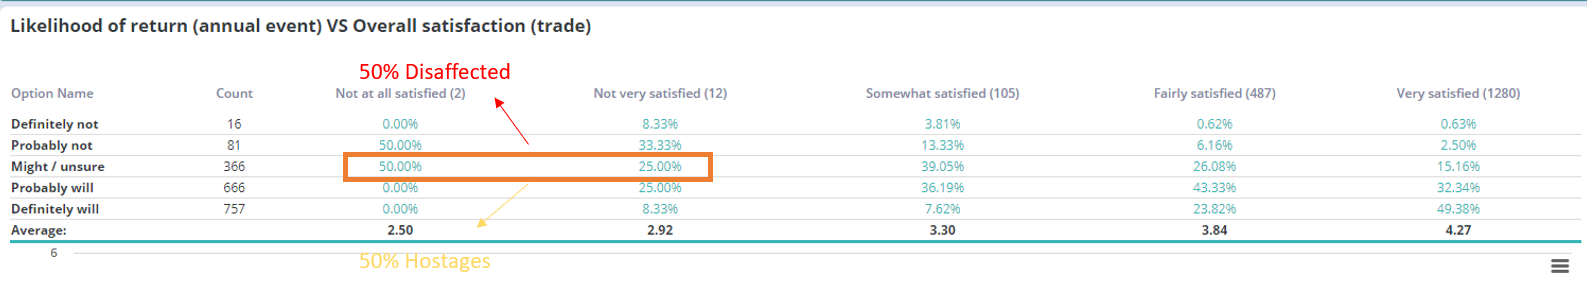
Any respondents that fall between two groupings will have their response apportioned 50% between the two groups:
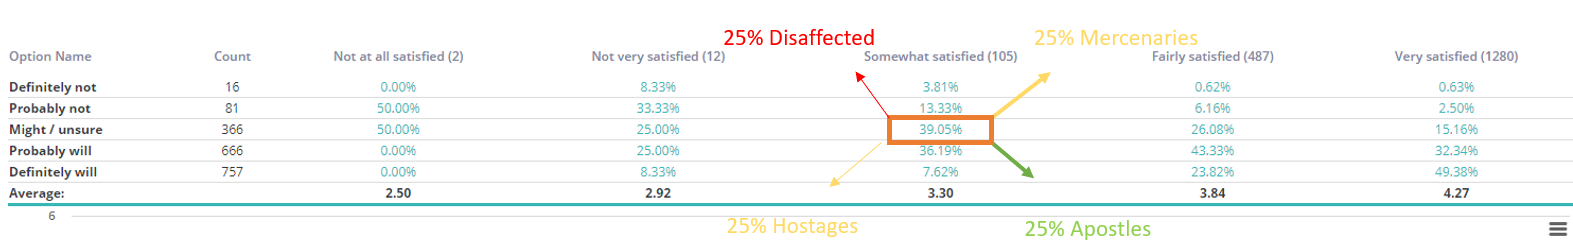
And any respondents that are both 'Somewhat satisfied' and 'Might / unsure' to return have their response apportioned 25% to each group.