.png?height=120&name=explori_logo%20(1).png)
An explanation on how Explori's Overall Event Score is calculated, what the Score means and how this is applied to your event evaluation.
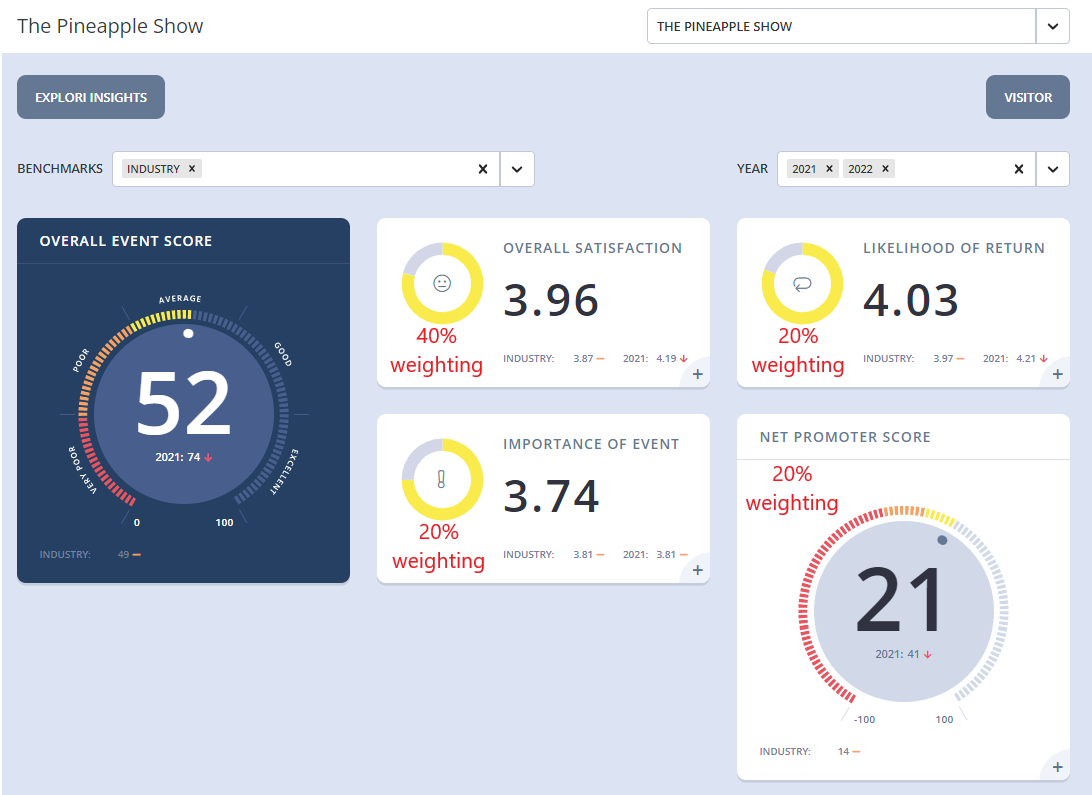
Overall Event Score (also known as Overall Show Score) is a composite metric found on the Product Dash in Explori for benchmarking surveys which gives a summary of the performance of your event relative to Explori's industry benchmarks. This is the primary metric that Explori uses to judge event performance as it takes a range of KPIs into account to give a better picture of event performance, rather than just taking one standalone KPI such as Net Promoter Score.
Overall Show Score is exclusive to Explori due to our large database of benchmarking data of over 4,000 events worldwide which use Explori's to conduct their post-event feedback surveys.
This is calculated by using the 4 core questions used in the vast majority of all surveys:
- Overall Satisfaction
- Likelihood of Return
- Net Promoter Score
- Importance of Event (Value for Money in consumer visitor surveys, Value for Time in virtual event surveys)
In addition, for Corporate Event surveys we also include the Impact Score questions, for which this article will describe how the scores for these questions are calculated.
The performance of the event on each of these KPIs is then compared to Explori's database to provide a percentile rank. On each of the KPIs within the Product Dash, the colour of the bar indicates the event's performance, dependent on how the show has scored relative to Explori's industry benchmarks and given one of five colours:
| Colour | Ranking |
| Red | Between 0-20th % rank |
| Orange | Between 20-40th % rank |
| Yellow | Between 40-60th % rank |
| Light green | Between 60-80th % rank |
| Dark green | Between 80-100th % rank |
To calculate Overall Show Score, the ranking of each KPI is given a weighting, indicated by the diagram below (40% to Overall Satisfaction, 20% to the other three KPIs), which are then summed to give a score between 0 and 100.
Note that where one of the KPIs are missing, the remaining KPIs will have their weightings adjusted to provide an Overall Event Score:
- If Overall Satisfaction IS included, then Overall Satisfaction would then have a weighting of 50% and the two remaining KPIs would have a weighting of 25% each
And if Overall Satisfaction IS NOT included, then the 3 remaining KPIs would each have a weighting of 33.3%.
An Overall Show Score of 0 would indicate that the show sits at the bottom of Explori's benchmarking data for all KPIs, whereas 100 would be the highest rated event for each of the KPIs.
Below are two worked examples based on how Overall Show Score is calculated.
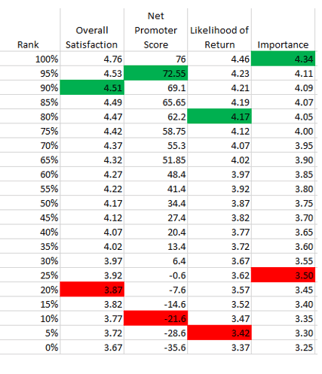
- For the Green Event =
(90% x 40%) + (95% x 20%) + (80% x 20%) + (100% x 20%) = 91%
Overall Show Score = 91 - For the Red Event =
(20% x 40%) + (10% x 20%) + (5% x 20%) + (25% x 20%) = 16%
Overall Show Score = 16
NOTE - Overall Show Score is a 'live calculation' as it takes into account the performance of any shows which take place after the survey in question. Even if the survey is closed, the Overall Show Score may change slightly (movement of less than +/- 1.00) given a show's performance relevant to all shows in the Explori benchmarking database.