.png?height=120&name=explori_logo%20(1).png)
Reports are where you have visibility of the results once responses start getting collected for your survey. The main features to be aware of and best practices will be discussed below;
The first thing you will see is the Survey Completion Statistics and this gives you a snapshot of the surveys performance with a page by page breakdown.
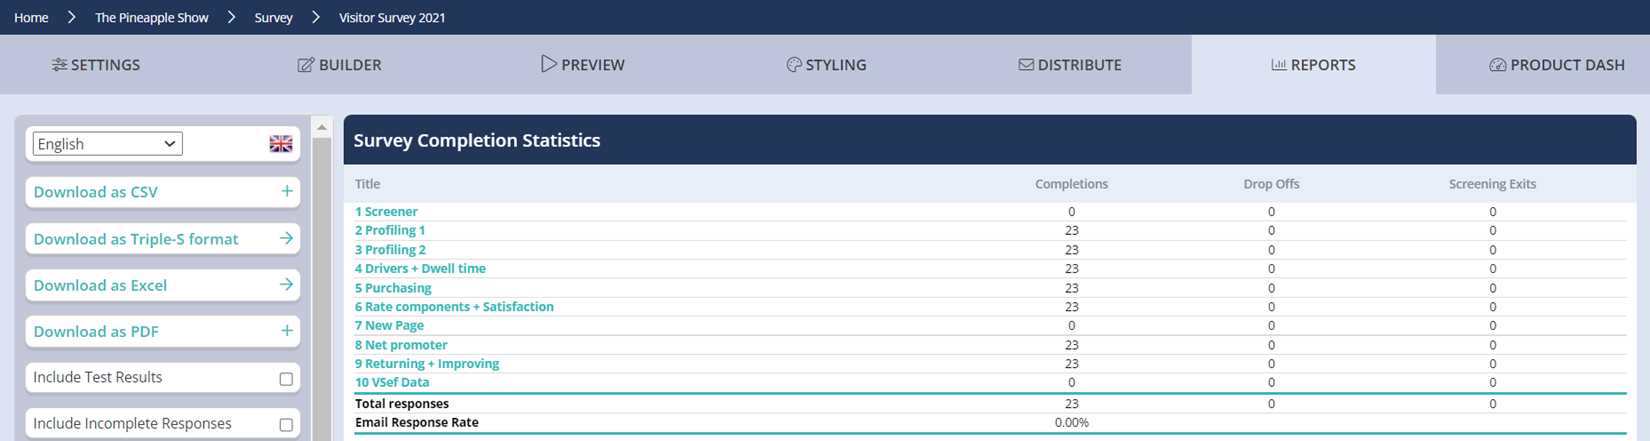
What your seeing in the first Column (Title) is the pages rather than the questions, highlighting the importance of naming them correctly. This makes it easier to navigate through the survey and use the cross tabs as a result. The other columns are as follows;
- Completions: Respondents that navigate through the entire survey and reach the completion page will be marked as a complete and contribute towards the "Total responses".
- Drop-offs: This when the respondent leaves the survey with the report showing you the number of exits on each page. If they decided to return and finish it, they will be returned to the last page they completed.
- Screen Exits: Respondents can be screened from a survey as a result of an answer given for a question. This is done using page-to-page logic and a screening question at the beginning of the survey. That way you can ensure that the right visitor type is taking part.
You will see the following buttons on the left-hand side of the report with Explori providing several formats for you to download your report in.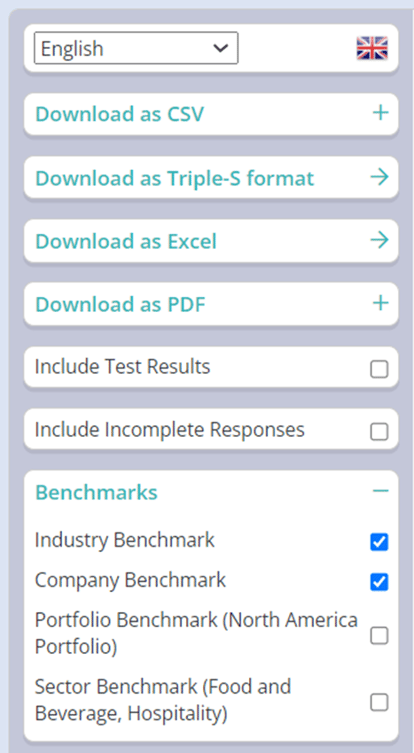
- Download as CSV: This will download the report in a CSV format with this providing you with the individual responses for each person that took part in the survey. This can be useful if you have included a prize draw or training opt-in and want to know the details of those that put themselves forward.
- Download as Triple-S format: It is mainly used for statistical purposes and is a language for describing survey metadata. This can be useful if you wish to import your data into other programs.
- Download as Excel: This will breakdown your results page by page with graphs also provided. This will not provide you with the individual breakdowns as a CSV would but it will export the results in a format that is easier to read for further analysis.
- Download as PDF: The report will come in a PDF format that will include graphs and open-ended questions if you select it.
- Include Test Results: The option is there to include test results if you wish to make sure that the survey is working as expected and it is reflected in the survey completion statistics.
- Include incomplete Responses: Incomplete responses can be included in the report to provide more data for analysis.
- Benchmarks: The industry and company benchmarks are automatically selected and can be used for analysis when comparing against results received for each of the Explori questions. You can also include the portfolio benchmark by ticking the text box.