.png?height=120&name=explori_logo%20(1).png)
Explori have overhauled the previous Dashboard views that were available to its users (Product Dash, Company Dash, Company Table) and have now replaced these with a new set of updated tables which give the ability to incorporate external data sources alongside event feedback scores.
To access these new Dashboards, you can go into the 'Company Dash' option within the Menu, or click on 'Product Dash' when you are viewing an individual survey.
Like all benchmarking data in Explori, these dashboards are split into the different types of events that Explori supports:
Expos: Trade, Consumer, Conference, Virtual Event
Corporates: Internal, External, 3rd Party Exhibit
This article will summarise the functionality of these Dashboards, and by clicking on any of the section headers you will be able to view a more in-depth article about them.
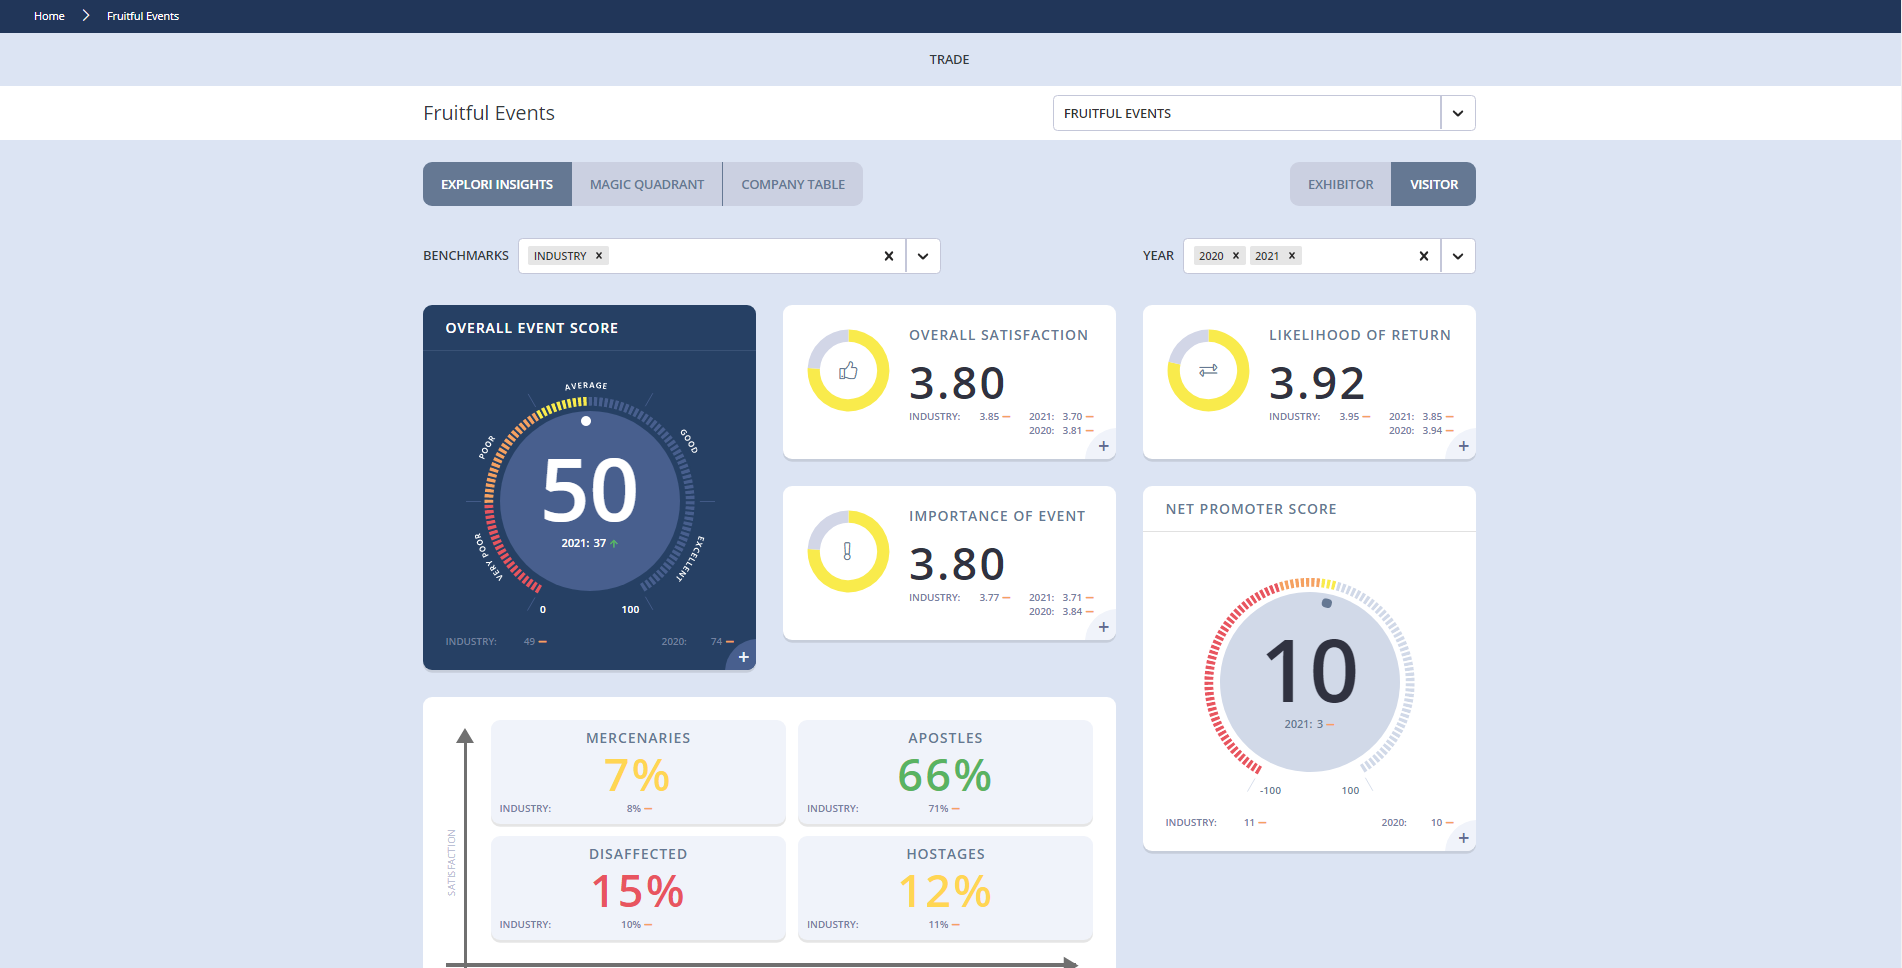
The main Dashboard view will give a summary of your KPIs with the ability to compare this to Explori's Industry Benchmarks, as well as your Portfolio and Company Benchmarks (if applicable).
Using the dropdown in the top right hand corner, you have the ability to quickly change between Company, Portfolio, and Event views - depending on what selection is made, the KPI scores available may vary.
If using the Company or Portfolio views, you now have the ability to track KPI performance year on year beyond Event level, with rolling yearly averages allowing you to see clearly how the wider business or specific portfolios have performed over time.
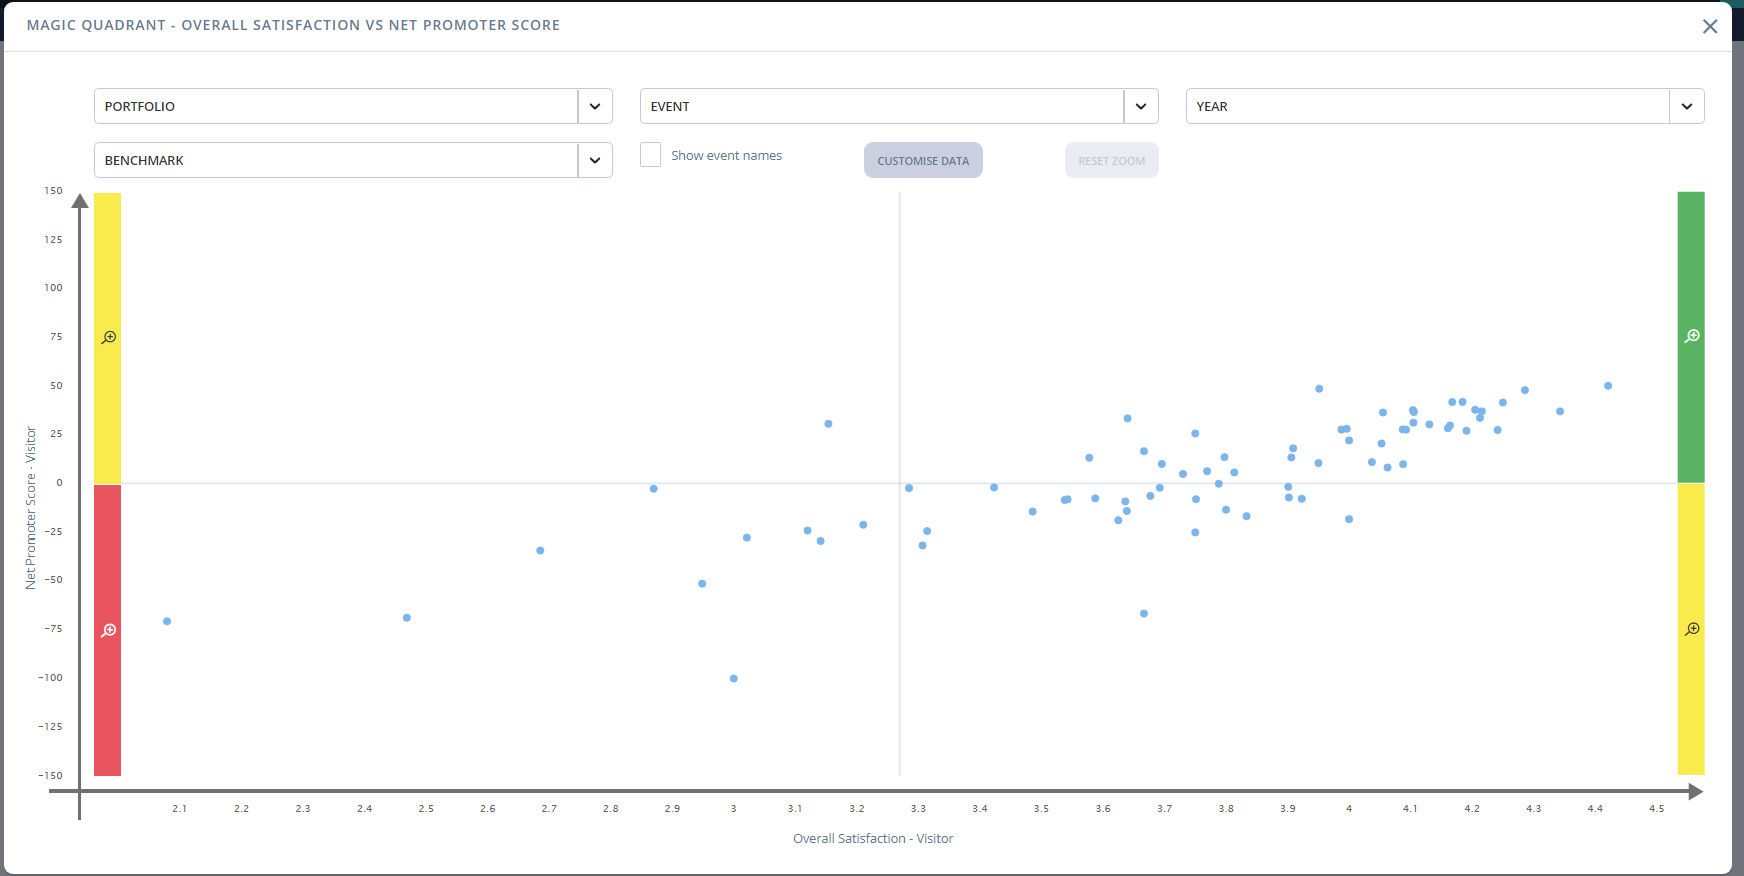
Brand new to Explori, Magic Quadrants gives users the ability to use data visualisation tools to better understand event performance across their company and will allow users to see trends and focus on events that may require more attention.
By selecting the KPIs that you want to chart, users can click-and-drag to focus on areas of the chart as well as have the ability to directly compare visitor and exhibitor metrics in direct comparison to see a true reflection on how an event is meeting its customers' needs from both sides.
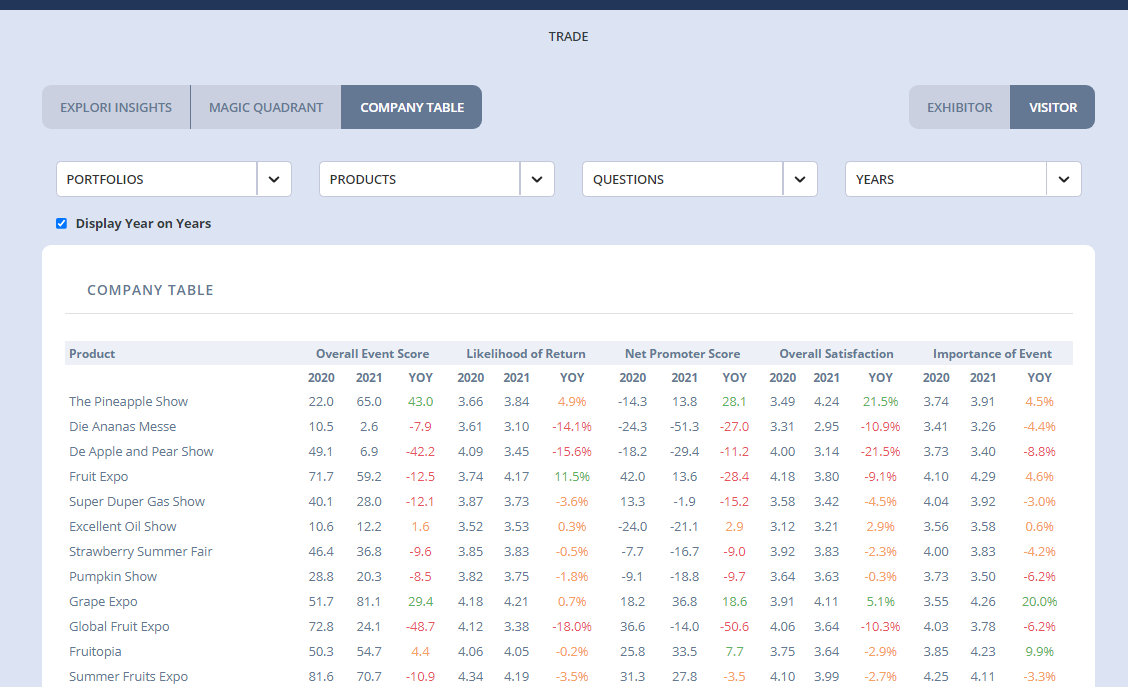
The Company Table has also been overhauled - now with the ability to load in data from every year the event has run, not just the last 3 years. You'll also notice the load time to bring up this view is much quicker, even when including all historic data.
Users are also able to show and hide the various KPIs for a customised view, along with sorting each column by clicking on the relevant column header.