![explori_logo (1).png]](https://kb.explori.com/hs-fs/hubfs/Explori%20logos/explori_logo%20(1).png?height=40&name=explori_logo%20(1).png)
The new and improved Explori Dashboards allow you to do a lot more with your data. The Dashboards are fully customisable, allowing you to visualise data to your specific needs. Below, we will show you how to create your own dashboard.
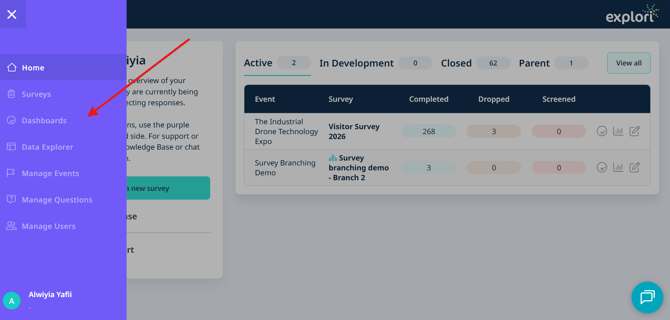
First, head to dashboards via the menu.
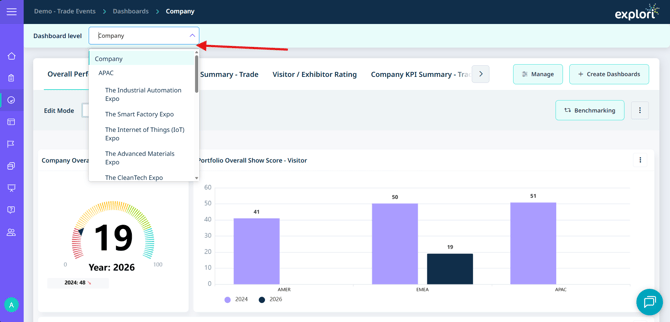
Choose your dashboard level
Select the level of dashboard you would like to create on the top right. You can create a Company, Portfolio or Event Level dashboard. For event or portfolio, select the event/portfolio you would like to create the dashboard for. Once the dashboard has been created, you can also make it a template and apply it to all dashboards of that level.
On the top right, select ‘Create Dashboards’ and name the dashboard. You can select a template to work from one of the dashboards we have created. In this case, we will be starting from scratch.
Create your widgets
Please view this article on how to create and customise your widgets using the widget creator.
Adding filters to your Dashboard
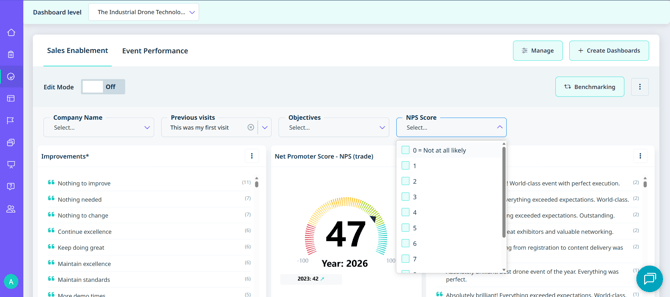
Filters can also be added to your dashboard to drill down on more specific data points, making it easier for you to visualise the metrics that matter most to you. You can apply multiple filters at once to quickly compare different viewpoints. If you would like to add filters to your dashboard, please contact your Explori lead.