How to prepare the seven data points crucial to measuring the success of your exhibit
What data does Maxbi collect? How to prepare for inputting the necessary stats to measure your exhibit's return on investment (ROI) and how well it has met your exhibiting objectives against your business goals.
Watch Chloe Richardson explain the 7 pillars of Exhibit Data in Maxbi
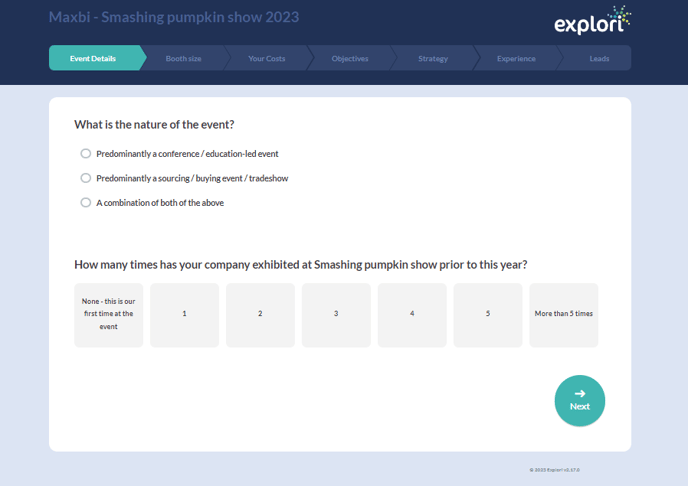
Here is the overview of the seven key data points that Maxbi captures.

The seven data points are:
- Event details: The nature and how frequently you exhibit at the event.
- Booth information: Details about your booth, such as the size and structure of it and the number of personnel working throughout the exhibition.
- Your costs: Allocate your expenditures for this exhibition, such as the cost of the booth space, design costs, travel and accommodation, logistics fee, marketing costs and so forth. Our system supports spending in U.S. dollar, euro and pound.
The cost can be allocated throughout any stage of the event. If there are any uncertain costs, you can enter an estimation or indicate you have “no access to this information” and amend the numbers after the event is over. - Objectives: Select the key objectives of exhibiting at this event from the seven common objectives, for example, generating new sales leads and capturing target customer data. If you have an objective not on the list, please select the option “Other” and specify what that objective is.
After you have chosen your key objectives, please rate their importance for this exhibition and how successfully they were met. - Strategy: You then move on to enter your exhibit strategy, which includes the types of personnel presented at your booth, what kind of activities you have conducted to support your exhibition, how far in advance did you book the booth and so on.
- Experience: This is where you tell us about your overall experience at the event, which includes how important the event is to your business, the quality of attendees at your booth, etc.
- Leads: This is where you evaluate your lead captured at the event, which details the proportion of hot, warm or cold leads and how they were captured.
We would recommend that you gather all the above data to be input by a single person. There is also flexibility to input data throughout every event stage to update to more accurate stats after the event.