The Explori Insights page can found in the new dashboards, and can be accessed by either...
- Accessing the 'Company Dash' via the Menu:
- clicking on the 'Product Dash' icon on the Home page:

- or by selecting 'Product Dash' from the Surveys menu:

When accessing the default Company View, you'll see the ability to switch between the different types of events that you have access to, split into the different types of events that Explori supports:
Expos: Trade, Consumer, Conference, Virtual Event
Corporates: Internal, External, 3rd Party Exhibit

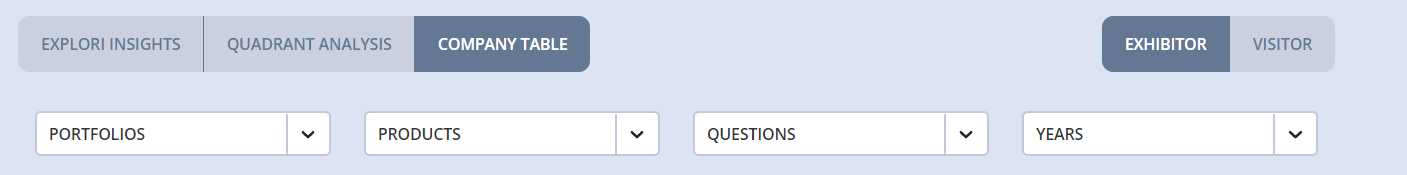
The dropdown at the top right corner of the page will allow you to change between viewing the overall Company scores, the Portfolio(s) that you have access to, and the event(s) that you have access to.
Below that there are further dropdowns which will allow you to select the relevant combination of event years and benchmarks, if your account has access to them:
At the bottom right corner of each KPI is a + symbol - clicking on this will expand out the KPI to view a chart:
- On the Company view, this will show year-on-year comparisons between the Portfolio(s) you have access to.
- On the Portfolio view, this will show year-on-year comparisons between the event(s) in that Portfolio, for the event(s) you have access to.
- And on the Event view, this will show year-on-year comparisons for the year(s) that the event has been surveyed in Explori.